Cosine Graph
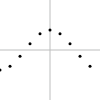
Based on Fabian's cosine-graph sketch, ten points trace one cosine cycle across the canvas. The gray horizontal and vertical lines are axes, and the curve's amplitude is reduced to 20 pixels so it fits the square surface. This is a static drawing of the source's cosine-only curve.
// ABOUTME: Plots cosine samples alongside two gray axes.
// ABOUTME: Ports Fabian's static cosine graph to GIC dimensions.
// Source: https://snippets.qawsed.site/p5js/motion/sine-cos-graph/index.js
background("white");
stroke(80, 0, 0);
line(0, 50, WIDTH, 50);
line(50, 0, 50, HEIGHT);
stroke("black");
strokeWidth(3);
repeat(step, 0, 10) {
	let x = step * 10;
	let angle = x / WIDTH * 360;
	let y = 50 + cos(angle) * 20;
	point(x, y);
}